2013 Global Construction Survey

In 2013, KPMG interviewed executives from 165 engineering and construction companies around the world, serving a range of markets including energy, power, industrial, healthcare/pharmaceutical, manufacturing, mining, education and government.

Key findings:

1. “66 percent feel that national governments’  infrastructure plans are the single biggest driver of market growth”

2. Slow recovery / growth continuing with “stable or higher margins”

3. “budget deficits and public funding is the biggest barrier to growth”

4. Growth areas: “power and energy top the list by a significant distance, other target sectors include water, rail, mining, and roads and bridges”

5. Standardization is critical to improving “project and risk management”.  “Whenever new people start on a project, they bring with them different processes. To spread good practices,  contractors can increase their use of… ” cost estimating and …. “project management software and step up training…. consolidate project delivery, and tighten
all leakages as much as possible.”

6. “Become a strategic partner to clients’ businesses By working more closely with clients from all sectors….”

via http://www.4Clicks.com – Premier cost estimating and efficient project delivery software solutions for JOC, SABER, IDIQ, MATOC, SATOC, MACC, POCA, BOA, BOS … featuring an exclusively enhanced 400,000 line item RSMeans Cost Database, visual estimating/automatic quantity take off ( QTO),  and collaborative contract/project/document management, all in one application.   Our technology is currently serving over 85% of United States Air Force bases and rapidly growing numbers of other DOD and non-DOD (United States Army Corps of Engineers,  Army, GSA, Homeland Security, VA..) federal departments/agencies, as well as state/county/local governments, colleges/universities, healthcare,  and airports/transportation.  RSMeans Strategic Partner.


The Metrics of BIM – The Manage the Built Environment

As the old saying goes…”you can’t manage what you don’t measure”.


Here’s the beginning of a list of information requirements spanning various domains/competencies, technologies, etc.,
While an important component, the 3D component of BIM has been a very unfortunate distraction.  It appears that many/most have “gone to the weeds” and/or are “recreating the wheel” vs. working on core foundational needs such as the consistent use of appropriate terminology and the establishment of robust, scalable and repeatable business practices, methodologies, standards, metrics and benchmarks for facilities and physical infrastructure management.

It is common terminology that enables effective communication and transparency among the various decision makers, building managers, operators and technicians involved with facilities and physical infrastructure investment and management.

Here are examples of metrics associated with the life-cycle management of the built environment:

Annualized Total Cost of Ownership (TCO) per building per gross area = Rate per square foot

Annualized TCO per building/Current replacement value = Percent of Current Replacement Value (CRV)

Annualized TCO per building/Net assignable square feet = Cost rate per net assignable square feet per building

Annualized TCO per building/Non-assignable square feet = Cost rate per non-assignable square feet per building

Annualized TCO per building/Building Interior square feet = Cost rate per interior square foot per building

Churn Rate

Utilization Rate

AI (Adaptation Index) or PI (Programmatic Index) = PR (Program Requirements) /
CRV (Current Replacement Value)

Uptime or Downtime – Defined in percent, as amount of time asset is suitable for the program(s) served.

Facility Operating Gross Square Foot (GSF) Index (SAM Performance Indicator: APPA 2003)

Custodial Costs per square foot

Grounds Keeping Costs per square foot

Energy Costs per square foot

Energy Usage

Utility Costs per square foot

Waste Removal Costs per square foot

Facility Operating Current Replacement Value (CRV) Index (SAM Performance Indicator: APPA 2003)

Planned/Preventive Maintenance Costs per square foot

Emergency Maintenance Costs as a percentage of Annual Operations Expenditures.

Unscheduled/Unplanned Maintenance Costs as a percentage of Annual Operations Expenditures.

Repair costs (man hours and materials) as a percentage of Annual Operations Expenditures

FCI (Facility Condition Index) = DM (Deferred Maintenance) + CR (Capital Renewal)
/ CRV (Current Replacement Value)

Recapitalization Rate, Reinvestment Rate

Deferred Maintenance Backlog

Facilities Deterioration Rate

FCI (Facility Condition Index) = DM (Deferred Maintenance) + CR (Capital Renewal) /
CRV (Current Replacement Value)

AI (Adaptive Index) or PI (Programmatic Index) = PR (Program Requirements) /
CRV (Current Replacement Value)

FQI (Facility Quality Index) or Quality Index or Index = FCI (Facility Condition Index)+ AI (Adaptive Index)

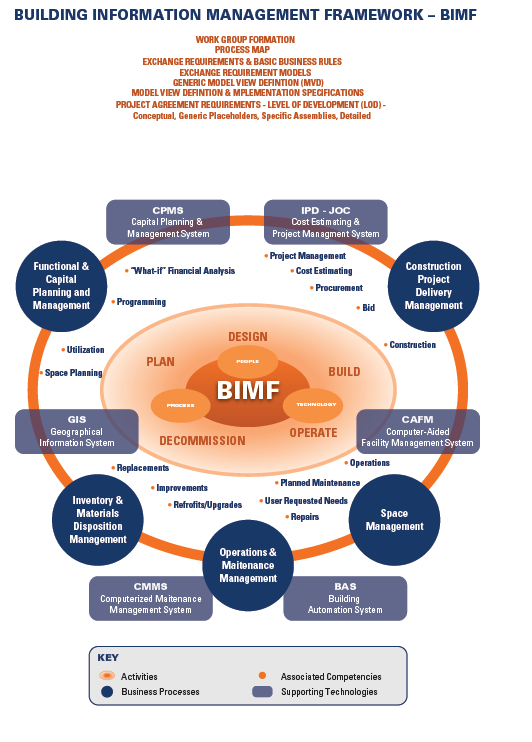
BIMF - Building Information Management FrameworkVia http://www.4Clicks.com – Premier cost estimating and efficient project delivery software for the built environment – , …

Estimating, Project Delivery Methods and Improved Construction Productivity

Accurate construction estimates are a fundamental component of any successful construction project.

The more accurate the scope of a construction project, the more accurate the estimate.

To achieve accuracy in both the scope and the estimate requires collaboration and communication among Owners, AE’s, and Contractors.  Thus, while many/most AEC professionals could likely provide an accurate estimate if provided an accurate, detailed scope of the project, the latter is rare.

The endemic lack of collaboration among Owners, AEs, and Contractors, as well as relatively low percentage of timely accurate construction project scopes are both due to the inconsistent application of robust project delivery methods.

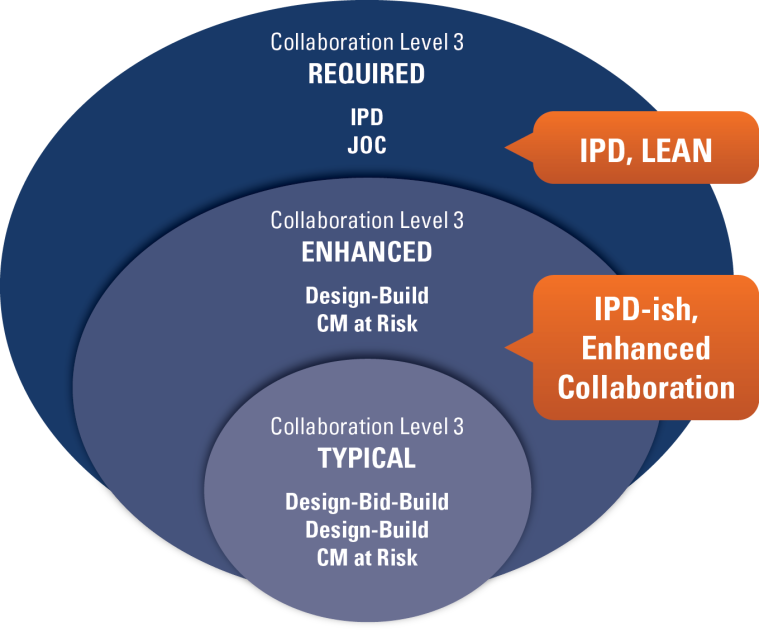
Any significant improvement in construction cost estimating and associated procurement, project management, and actual job-site work must be based in the development and deployment of efficient project delivery methods, such as Integrated Project Delivery (IPD), IPD-lite, Job Order Contacting(JOC).

Accurate scoping requires a knowledge of the construction processes. Unit costs and standardized data architectures and lexicon play key roles in accurately communication project requirements, however, AE, site, and execution components all impact unit pricing.

Converting scope to quantities requires a solid understanding of construction techniques, working with numbers, drawing scales, waste factors, plan reading, conversion factors, labor/material/crew/equipment variables …. and quantity take-off (QTO) and unit, assembly, system, and square foot costs are all important aspects.  For example, professional estimators..whether Owners, Contractors, or Independent,  get their unit costs a wide range of sources… historical information, contractors, trades, business product manufactures, as well as published national average, and localized cost data.
While a  lump sum price is so much more than “just” the total of unit material, labor and equipment costs, unit costs and standardized cost data architecture do, however, help in mitigating “missed items” and in communicating and resusing cost data.

via-www.4Clicks.com – premier software for efficient project delivery – JOC, SABER, IPD, SATOC, MATOC, MACC, IDIQ, POCA, BOA.